Generic Functions
Filter
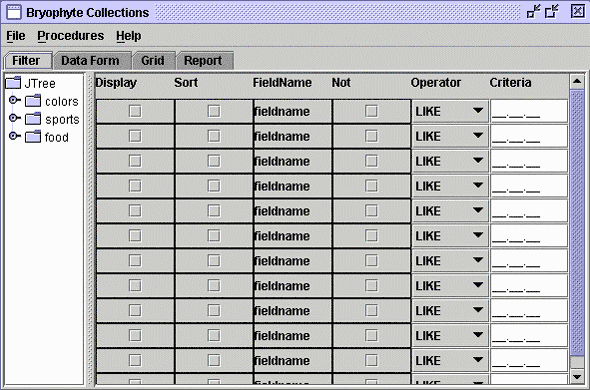
The Filter tab sheet in the data frame displays a filter tree within a subframe as a standard interface for initiating queries. It is a branching diagram of the table's fields and of links to related tables. Clicking a button will display the field structure of a related table. A click on the plus sign beside any item displays fields and filter subtrees below the item.
A non-functional example can be accessed in the navigation frame via the projects tab sheet. Select the "BSM Collection Bryophytes" item and open this project in the context menu (right mouse bottom). (In the current version, access to the items in the subtree is disabled.) Subsequently select the Filter tab sheet in the data frame.
- Defining queries: If there are no saved queries or a predefined query with the necessary search criteria, one can create a new query. To launch a new query, the subframe filter tree has to be accessed. When a data field in the filter tree is selected, a query form appears in a data frame. The query form can be used to define a search expression. (to be implemented)
- Opening and saving queries. If one desires to receive data as a report, he/she needs to use a predefined query that already has a report format associated with that query. (to be implemented)
- Performing a query to one or simultaneously to more than one database within a project: Selection criteria list (Display – Sort – Field Name – Not – Operator – Criteria). (to be implemented)
- Interactive identification in connection with a DiversityDescription compatible database. (to be implemented)
Report Definitions
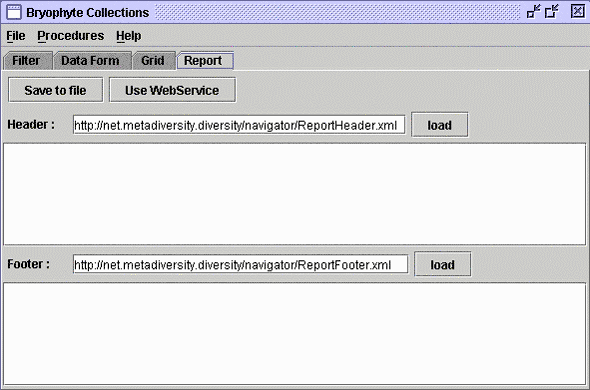
The Report tab sheet helps to create and manage reports related to the database contents.A non-functional example can be accessed in the navigation frame via the Projects tab sheet. Select the "Bryophyte Collections" item and open this project in the context menu (right mouse bottom). [In the current version, access to the items in the subtree is disabled.] Subsequently select the Report tab sheet in the data frame.
- Creating report templates
Reports need have an XML-formatted header (and footer). The latter may be deposited as XML documents locally or on server and downloaded from the internet. For further processing, the tables may be locally saved or submitted to a Web Service [– the option of selecting between different web services is to be implemented]). - Loading and saving report templates
- Generating reports of database contents
Output files:- Text files
- Database tables
- Generating combined reports of more than one database
Examples:- Statistics
- GIS
Procedures
General Procedures
On top of the user interface, menu points for the following general procedures are provided:
- Data Transfer: Database import and export as well as data transfer between different databases via client (only databases with corresponding data fields); [all functions disabled, but in the present version – import functions p. pte. implemented in menu of data frame for the Checklist project item].
- Import XML: import of XML-coded checklist file [generated by checklist parser function (see Data Validation and Data Conversion)].
- Import XML from file list: import of XML-coded checklist files from file list
- Import XML: export of XML-coded checklist file
- Data Validation: Parser functions for validatation of contents and syntax [all functions disabled, but in the present version – validation of checklist data p. pte. implemented in menu of data frame for the Checklist project item].
- Convert to XML: syntax checking parser function for XML-embedded checklists (with proprietary markup) during conversion into pure XML.
- ––
- Data Extraction: e.g. CODATA elements [– to be implemented]
- Data Conversion: data conversion between different formats (HTML, XHTML, XML, ASCII, UTF8, etc.) [– p. pte. implemented]
- Convert to XML: function to convert XML-embedded checklist (with proprietary markup) into pure XML + syntax checking parser function
- ––
Special Procedures
[[– to be implemented]Special Tree Views
- [– to be implemented]
- Viewing (XML-coded) phylogenetic tree data
- Viewing and editing (XML-coded) taxonomic tree data