GridView_old
The Grid View
- In upcoming versions, a Grid tab sheet in the data frame will display the same information as the Data Form tab sheet but in rows and columns instead of in controls. The columns of the Grid tab sheet will correspond to the top-level fields displayed in the Data Form tab sheet. This tab will let you view several records at once. Each row will display a separate record, and each column of that row is a field in the record.
- In some windows, the Grid tab sheet will have its own set of sub-tabs, which means that the user will be able to choose between information from two or more grid views. Each sub-tab will display records of a particular type.
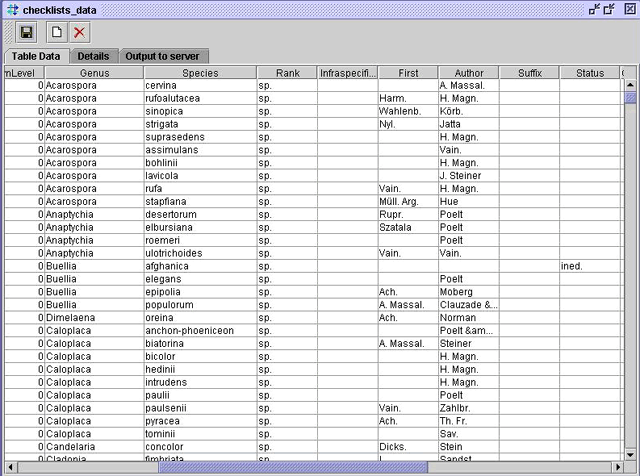
- In the actual version, viewing and editing of table contents is possible only with regard to individual database tables. However, changes of data entries via these tables should be done carefully since they may result in conflicts in the case of multi-tabular data sets. A functional example can be accessed in the navigation frame via the projects tab sheet. Select the "Checklists" item and open this project in the context menu (right mouse bottom). [In the current version, access to the items in the subtree (Diversity Workbench: "M Taxonomy", "M References", and "M Gazetter") is disabled. In upcoming versions subsequently select the Grid tab sheet in the data frame.]
- In upcoming versions, viewing and editing of data contents of more than one database will be enabled.
Edit page
Add Comment
Attach File
Page Info
My Prefs
Create group
DiversityNavigator Version 0.97.21
This page (revision-1) last changed on
13:12 09-Oct-2006
by unknown.